ANNUAL CHARGEBACK REPORT & STATISTICS
Introduction
Midigator’s The Year in Chargebacks report takes an in-depth look at payment disputes. The data in this second-annual publication provides unprecedented insight into why chargebacks happen, how to prevent and fight chargebacks more effectively, and what’s in store for the future.
At Midigator, we believe data analysis is one of the most impactful elements of a successful chargeback management strategy. Data-driven decisions produce far better results than guesses and assumptions. The Year in Chargebacks report is designed to help you recognize the value of data analysis and the role it can play in chargeback management.
Ultimately, we want to help you create intelligent, effective strategies that will lead to a significant improvement to your bottom line.
We hope this resource is valuable to you!
The Year in Chargebacks is an annual publication. Click here to view the 2019 report.
The data in this study was collected from a subset of merchants who used Midigator to manage chargebacks for 12 consecutive months. These merchants were chosen because they represented a broad spectrum of billing models, industries, transaction volumes, and dispute management styles.
Merchants in this study ranged from small startup businesses to large enterprise brands. In 2019, individual chargeback counts ranged from 14 disputes a year to 105,285. Annual sales ranged from $25,000 to $186,200,000.
The 2019 data was generated from 25.1 million transactions and $1.1 billion in total transaction volume.
The Year in Chargebacks report is the first quantitative yearly report in the industry, differentiated from the qualitative reports that have previously been released. The data reflects the outcomes that Midigator helps merchants achieve.
Discover greater insights. Download the exclusive version of the report now!
Report Overview
What are the most important conclusions that can be drawn from The Year in Chargebacks? Here is a high-level overview of the most significant insights in the 2020 report and tangible recommendations for merchants to manage their own chargebacks.
Why does The Year in Chargebacks report show a decrease in year-over-year trends when other studies indicate chargeback risks are intensifying?
The difference is an ongoing effort to prevent disputes.
Chargebacks are still a significant threat as this report’s 2.59% chargeback-to-transaction ratio indicates. If merchants didn’t make any effort at all to reduce risk, the data in The Year in Chargebacks would be much different.
However, the merchants in this study recognize the dangers that chargebacks pose to their business and have been focused on reducing them.
Therefore, the drop in the chargeback-to-transaction ratio emphasizes the effectiveness and value of Midigator’s ongoing, proactive chargeback prevention efforts.
Recommendations
Merchants are encouraged to create a comprehensive chargeback prevention strategy to reduce unnecessary revenue loss, costs, and penalties.
This should include a combination of pre-sale (address verification service, card security codes, third-party vendors, etc.) post-sale (prevention alerts, Consumer Clarity, and Order Insight), and post-chargeback (analytics) initiatives.
Friendly fraud happens when a cardholder uses the chargeback process incorrectly, either as an intentional attempt to get something for free or an innocent misunderstanding.
Friendly fraud is a significant concern for most merchants. And now, it’s becoming harder and harder to fight it.
The Visa Claims Resolution (VCR) initiative changed compelling evidence requirements for reason code 10.4 (Other Fraud – Card Absent Environment). Now a chargeback response needs to contain evidence that proves the cardholder’s identity was verified. This can be done with positive matches from address verification service (AVS), card security code (CVV2), and Visa Secure (3D Secure).
However, 55% of study participants chose not to use these tools. Because they didn’t have the required compelling evidence when it was time to fight, win rates for Visa’s fraud-related disputes dropped from 75.34% in 2018 to 41.12% in 2019.
Recommendations
Friendly fraud can be fought and won if merchants have the right compelling evidence. However, some merchants feel the identity verification tools that provide the evidence increase checkout friction.
Fortunately, it’s possible to have both a smooth checkout experience and the data to prove friendly fraud.
Merchants who don’t currently use identity verification tools may want to reconsider. By testing different acceptance rules, merchants can find the perfect balance for generating revenue and recovering revenue.
Fighting chargebacks can be a difficult task. And because it isn’t always easy, a lot of merchants don’t even try to recover lost revenue. However, that can be a costly mistake.
More than 75% of the merchants in this study had a win rate above 40% (the industry average). And 70% had a return on investment (ROI) above 200% with results reaching as high as 4,325%.
Ultimately, with the right evidence and the right response strategy, it pays to fight.
Recommendations
Merchants should create a strategy for fighting chargebacks that includes collecting necessary compelling evidence, setting fight rules to optimize ROI, customizing responses, and meeting submission deadlines. Technology can help ensure the highest win rates possible with the least amount of expenses.
The chargeback lag time—or amount of time that passes between the transaction processing date and the chargeback processing date—decreased significantly.
In 2018, 8.3% of chargebacks were filed within a week of the transaction processing date. In 2019, 14.58% of chargebacks were filed in seven days or less, resulting in a 75.54% difference year-over-year.
Recommendations
Shorter lag times are the result of the industry’s increasing use of automation and technology. Processes will continue to become faster and faster. If merchants aren’t likewise using technology, they may soon be unable to keep pace with the industry’s quicker standards.
For example, if merchants use a chargeback management platform that offers real-time reporting, they could capitalize on shorter lag times. The sooner merchants learn about hidden problems, the quicker they can solve them and prevent future disputes from happening.
Percent of Transactions that Turn Into Chargebacks
Is there an accurate metric to gauge the impact of chargebacks? What is the best way to monitor trends?
The most relevant and accurate insight comes from multi-dimensional analysis. It reduces the risk of assumptions drawn on incomplete data that can often happen without context. Therefore, one of the most helpful chargeback management metrics is the chargeback-to-transaction ratio—the percent of transactions that turn into chargebacks.
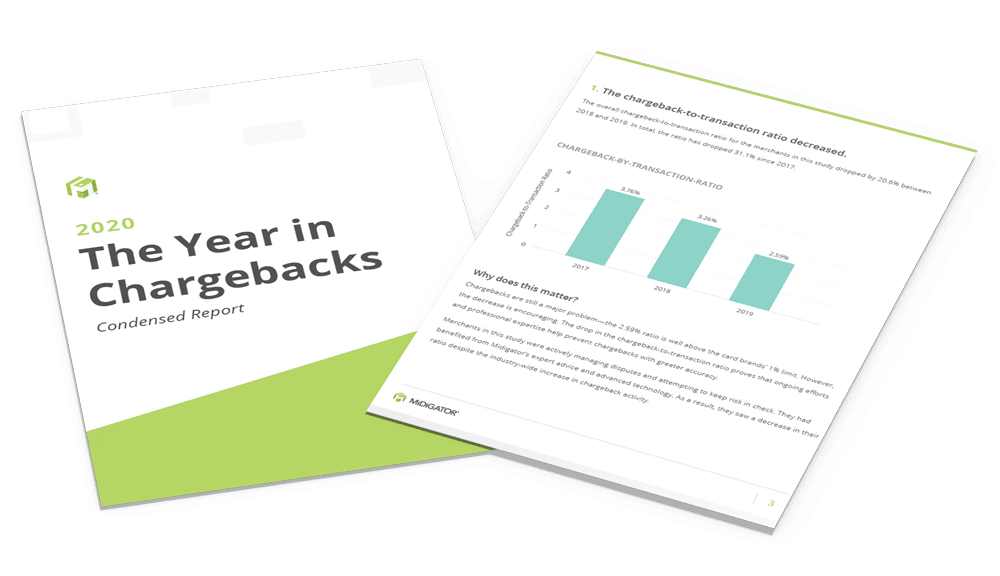
The overall chargeback-to-transaction ratio for the merchants in this study dropped by 20.6% between 2018 and 2019. In total, the ratio has dropped 31.1% since 2017.
The decrease in the chargeback-to-transaction ratio was universal for all card brands.
The chargeback-to-transaction ratio shows that payment disputes are still a major concern for merchants—especially for card-not-present transactions. A 2.59% ratio is well above the card networks’ 1% threshold. However, the year-over-year decrease is encouraging.
Merchants in this study were actively managing disputes and attempting to keep risk in check. They had benefited from Midigator’s expert advice and advanced technology. Therefore, the drop in the chargeback-to-transaction ratio suggests that ongoing efforts and professional expertise help prevent chargebacks with greater accuracy.
Percent of Revenue Lost to Chargebacks
The absolute “cost” of each chargeback varies and is impacted by several different expenses: lost processing fees, chargeback fines, labor costs for management, and much more. However, since the largest and most easily-defined loss is the transaction amount, monitoring the percent of revenue lost to chargebacks is likely the most accurate gauge of financial impact.
The total amount of revenue lost to chargebacks decreased by 18.52% between 2018 and 2019, totaling a 42.03% reduction over three years. This drop is relative to the decrease in the chargeback-to-transaction ratio.
Again, investing in proven-effective chargeback prevention strategies yields a positive ROI by reducing the amount of revenue lost to chargebacks.
However, there is no way to guard against all risk. Therefore, merchants are advised to have a plan in place to fight illegitimate chargebacks when they do happen, recover lost revenue, and protect their bottom line.
Why does The Year in Chargebacks report show a decrease in year-over-year trends when other reports show chargeback risks to be intensifying? The difference is an active and ongoing effort to manage risk.
If merchants didn’t do anything to curb the ever-present threat of chargebacks, these charts would look much different. However, the merchants in this study recognize the danger that chargebacks pose to their business, and Midigator has helped them take proactive action to reduce risk as much as possible.
Most Common Reason for Disputes
Why are transactions disputed? What reasons do cardholders and their banks offer?
Four different categories are used to classify chargebacks. These categories vary slightly based on the card brand but can generally be thought of as fraud, cardholder disputes, authorization issues, and processing errors. The cardholder’s bank reviews each case and picks the category (or reason) that seems to be the best fit for the dispute.
For the third year in a row, fraud-related disputes accounted for the vast majority of chargebacks. Also for the third straight year, the percent of disputes categorized as fraud increased. Visa fraud disputes increased by 5.4% and Mastercard showed a 9% increase.
The second most common category was cardholder disputes. Processing errors and authorization issues combined accounted for less than 1% of chargebacks.
Why are more and more chargebacks classified as fraud? Because the classification process is flawed.
The cardholder’s bank assigns a reason code to each chargeback before sending it to the merchant. Oftentimes, the reason code assignment is based on limited knowledge and insight.
In most cases, the bank chooses a course of action based on information the cardholder provides. If the cardholder is using the chargeback process incorrectly—a practice known as friendly fraud—the information provided to the bank could be inaccurate or incomplete. Thus, the reason code doesn’t reflect the real reason for the dispute.
Win Rates, Friendly Fraud, and the ROI of Fighting Chargebacks
Card brand regulations give merchants the right to respond to invalid chargebacks.
An invalid chargeback is an unnecessary or non-compliant payment dispute—a chargeback that shouldn’t have happened.
Some chargebacks are invalid because they don’t follow card brand rules. Other times, a cardholder uses the chargeback process incorrectly, either as an intentional attempt to get something for free or an innocent misunderstanding. This is called friendly fraud. And friendly fraud accounts for the majority of invalid disputes.
Last year’s report found that 77.25% of disputes classified as fraud were actually friendly fraud.
While merchants have the right to fight these invalid disputes, this year’s data shows it is becoming more challenging to win. The reason is because the Visa Claims Resolution (VCR) initiative changed compelling evidence requirements for reason code 10.4 (Other Fraud – Card Absent Environment). Now chargeback responses need to contain evidence that proves the cardholder’s identity was verified. This can be done with positive matches from address verification service (AVS), card security code (CVV2), and Visa Secure (3D Secure).
However, 55% of merchants in this study—who accounted for 82.7% of the transaction volume—chose not to use those tools because they were focused on providing the smooth and simple checkout process that today’s consumers demand.
As a result, there was a considerable decrease in year-over-year win rates for invalid fraud disputes.
Since Mastercard doesn’t have the same compelling evidence requirements as Visa, merchants maintained a high win rate for Mastercard’s fraud-coded disputes in 2019.
What does this mean? Does the data imply there isn’t any value in fighting chargebacks? Not at all!
Merchants do need to recognize the role identity verification tools play in fighting untrue fraud claims. If merchants opt for lower cart abandonment rates and fewer false positives (legitimate purchases that are incorrectly flagged as fraud), they sacrifice revenue recovery.
But it’s also important to note that there are other types of invalid disputes that can be fought and won. For example, a cardholder may claim that merchandise was never delivered, but it actually was.
Ultimately, most merchants found significant value in fighting chargebacks.
Merchants who excelled at collecting required compelling evidence and crafting customized responses were rewarded with impressive returns on their investments (ROI).
Length of Time Between the Transaction and Dispute
The chargeback lag time, or amount of time that passes between the transaction date and the chargeback date, provides valuable insight.
Each chargeback has a time limit—a deadline for when the cardholder’s bank must submit the dispute. The amount of time available and the specified start date vary based on the reason code used to dispute the transaction. However, most chargebacks must be filed within 75, 90, or 120 days of the original transaction.
While the overall trend for chargeback lag time seems nearly identical in a year-over-year analysis, there was actually an important difference. Chargebacks were filed more quickly in 2019. There was a shorter period of time between the transaction processing date and the chargeback processing date.
In 2018, 8.3% of chargebacks were filed within a week of the transaction processing date. In 2019, 14.58% of chargebacks were filed in seven days or less, resulting in a 75.54% difference year-over-year.
The differences were especially noticeable when lag times were broken down by dispute category.
| 2018 | 2019 | |
|---|---|---|
| Authorization | 13.84% | 64.57% |
| Consumer Disputes | 8.4% | 12.43% |
| Fraud | 8.26% | 14.98% |
| Processing Errors | 20.44% | 30.94% |
Another insightful analysis was comparing 2019 lag times for Visa against Mastercard.

17.44%

9.38%
While the pattern of activity was basically the same for both networks, Visa had a shorter lag time than Mastercard.
The speed of Visa filings combined with the considerable year-over-year differences in the authorization category are both likely the result of the Visa Claims Resolution (VCR) initiative.
Visa relies more heavily on technology now. Many workflows are handled with automation, which is quicker than manual processes.
It’s encouraging to learn that lag times are decreasing. The sooner merchants learn about hidden problems, the quicker they can solve them and prevent future disputes from happening.
It’s important to monitor chargeback lag times because the insight can help improve prevention efforts. For example, if the majority of chargebacks happen on day seven, merchants might want to reach out to their customers on day six to gauge satisfaction and address any issues.
Peak Time of the Year for Disputing Transactions
When are transactions disputed? Which months have the highest chargeback rates?
Of all the metrics that were analyzed in this year’s report, the chargebacks-by-month breakdown was perhaps the most surprising.
In 2017 and 2018, chargebacks spiked in January. This was an expected outcome. Because the holidays brought an influx in transactions during the months prior, there was a corresponding influx in chargebacks.
However, in 2019, one of the year’s lowest chargeback counts was recorded in January. Instead, the spike happened in the second half of the year.
There are two likely causes for these results. The first is the Visa Claims Resolution (VCR) initiative that went into effect in April 2018. After the new technologies and processes gained adoption, refinement, and clarity, VCR began to fulfill its objectives. It helped prevent disputes with greater consistency, regardless of seasonal influxes in transaction volume.
That stability lasted until Mastercard’s free trial rules went into effect in April 2019. Some of the study participants had to adjust their business practices in order to comply with updated regulations, and chargebacks increased before merchants were able to fully adapt to the new norm.
While it is possible to draw conclusions based on generalized trends, individual merchant results will likely be unique. In order to gain the most helpful insights, merchants should analyze their own monthly trends.
When doing so, it’s important to analyze within the context of chargeback lag time. Nearly 60% of disputes are filed within a month of the transaction. Another 24.5% happen between 30 and 60 days. Therefore, monthly trends typically relate to activity that took place one to two months prior.
Countries with the Highest Chargeback Rates
When expanding into new markets, merchants should evaluate the revenue potential of each individual country versus the anticipated risk. The following cardholder locations with 5,000 or more transactions had the 15 lowest and 15 highest chargeback-to-transaction ratios.
Some trends stood out in a year-over-year analysis. The high chargeback-to-transaction ratios for Peru, India, and Dominican Republic remained fairly steady from 2017 to 2019. And Norway, New Zealand, Sweden, and Switzerland had consistently low ratios.
However, other year-over-year trends were challenging to identify.
Merchants in this study increased international sales by 269% between 2018 and 2019. They entered new markets and, despite the high-risk nature of many countries, processed more transactions rather than less.
The risk seems to have paid off. More transactions yielded more data analysis opportunities which enabled more accurate decisioning. As a result, countries with high transaction volumes yielded a decrease in chargeback-to-transaction ratios between 2018 and 2019.
The fluctuating trends emphasize a noteworthy insight: evaluating risk on a country-by-country basis should be a dynamic process. Everything from customer preferences to politics and health crises can shift trends from one year to the next. Data analysis can help ensure educated decisions, rather than hunches and guesses, are driving international expansion.
Percent of Chargebacks Prevented
The most effective chargeback prevention strategies are the result of a multi-layer approach—multiple tools and actions applied at various points of the customer experience. While a multi-layer strategy is most effective, it is often difficult to determine the outcome of each individual prevention effort.
Moreover, some strategies have accurate metrics to gauge chargeback prevention but don’t factor in the risk of false positives.
However, chargeback prevention alerts is one tool that won’t increase customer friction or turn away good sales while also providing accurate data to monitor effectiveness.
Of those merchants who used chargeback prevention alerts in 2019, 56% resolved 30% or more of disputes before they progressed to costly and damaging chargebacks.
The merchants in this study showed an increasing interest in chargeback prevention alerts with 5.1% more merchants using alerts in 2019 than 2018.
Additional data in this study emphasizes the importance of incorporating prevention efforts into a comprehensive chargeback management strategy.
Just over 38% of participants’ customers were repeat offenders (customers who filed more than one chargeback).
The majority of cardholders, 61.36%, disputed only one purchase with the participating merchant. However, a significant portion initiated multiple chargebacks. In fact, an alarming 2.44% of cardholders filed five or more chargebacks—one cardholder disputed 35 purchases with a single merchant!
Prevention alerts have already been proven effective at helping merchants keep chargeback counts low. Order validation tools, such as Consumer Clarity and Order Insight, will play an increasingly important role as merchants strive for both a reduction in chargebacks and a reduction in revenue loss.
Data shows there were three reasons why customers filed multiple chargebacks:
- A fraudster first placed a test order and then made a larger purchase since the stolen card was valid.
- A cardholder bought something with a subscription billing model and disputed multiple months worth of purchases at one time.
- A cardholder made several one-time purchases on different days and sporadically disputed them.
All three of these situations can be managed to prevent unnecessary revenue loss and reduce the risk of threshold breaches.
Conclusion
The Year in Chargebacks report provides an unprecedented look at the payments industry and offers a valuable benchmark to evaluate individual chargeback management efforts.
If you’d like to achieve the same results as the merchants in this study, Midigator can help.
At Midigator, we believe the challenge of running a business should be delivering great products or services, not managing payment risk. Let us handle the chargebacks so you can focus on growing your business.
Discover greater insights. Download the exclusive version of this report now!