How to Use Data Analysis to Prevent Chargebacks & Disputes
-

- November 20, 2021
- 8 minutes
Data analysis is an essential part of chargeback management.
With data, you make educated decisions. But without data, you make hunches and guesses. You have no way of knowing what is actually happening, what will be an effective solution, or whether or not you’ve fixed the problem.
That’s why data analysis is a part of every chargeback management strategy that we help merchants create.
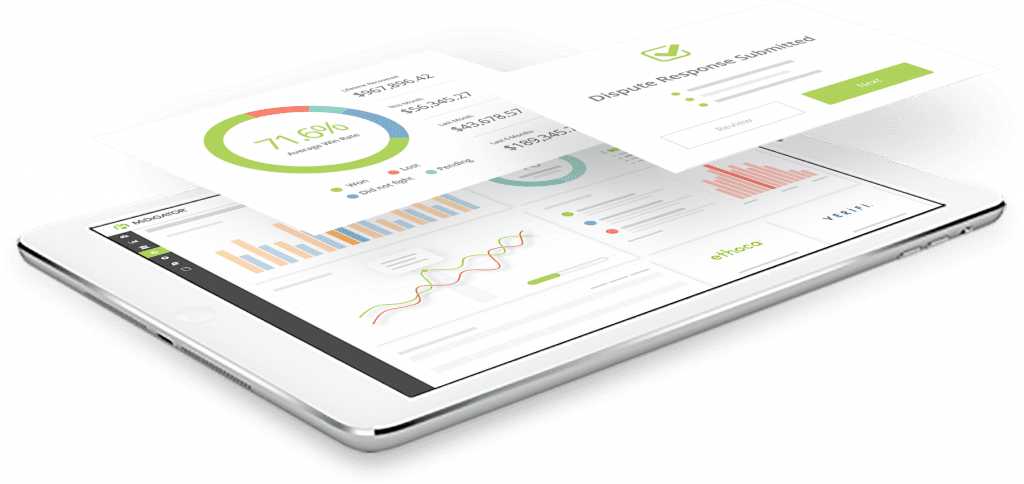
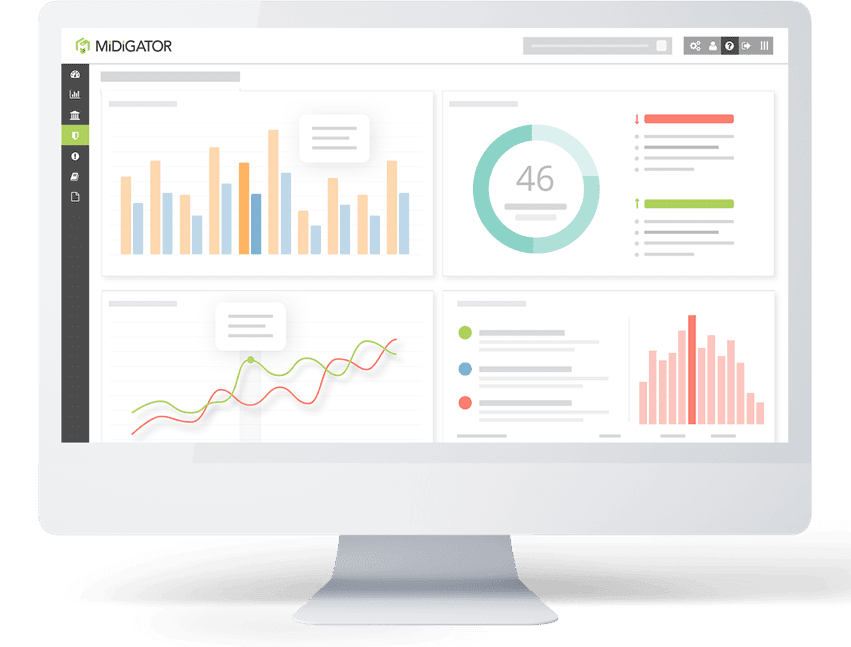
ABOUT MIDIGATOR®
At Midigator, our aim is to remove the complexity of payment disputes. We do this by simplifying processes with efficient, effective, and easy-to-use technology — and that includes data analysis.
In fact, Midigator was originally created because merchants didn’t have access to real-time dispute data. Now, Midigator is the platform that businesses of all sizes in all industries use to prevent, fight, and analyze chargebacks.
How Does Data Analysis Help Prevent Chargebacks?
Many times, when a chargeback is received, a merchant focuses solely on fighting the chargeback and recovering lost revenue. While this step is important, it isn’t the only thing to worry about.
Each chargeback you receive contains a wealth of information. If you analyze that data, you can gain valuable insights — including why the cardholder chose to dispute a charge. This allows you to solve issues at their source.
Consider the following chargeback management strategies:
WITHOUT ANALYTICS
- Based on hunches and guesses
- Capable of producing only short-term results
- Reactive
- Highly susceptible to false positives and unnecessary revenue loss
WITH ANALYTICS
- Based on intelligent, data-driven decisions
- Capable of generating sustainable success
- Preemptive
- Optimized for maximum ROI
However, data analysis can be challenging if you don’t know where to begin or what to look for. The following tips will help guide you in the right direction.
Create a Data Analysis Schedule
There are a few administrative tasks that need to be completed before you can actually start looking at your data. For example, think about your schedule. How often will you analyze your data? Daily? Weekly? Monthly?
Ideally, you’d have access to real-time data. This ensures you identify problems as soon as possible — long before issues become an unmanageable liability.
However, that is only possible if you use a service provider specifically designed for chargeback management — such as Midigator.
If you don’t have access to this type of reporting technology, you’ll have to determine what your in-house team is capable of with manual processes. How often will you be able to refresh your reports?
Once you have outlined a desired schedule for analysis, you can create a system to pull data from within that time parameter.
Collect and Organize Your Dispute Data
Your data is likely stored in many different places. You need to collect all the relevant information and funnel it into one platform. Places you should look include:
- Shopping cart, customer relationship management software (CRM), or order management system
- Payment processor portals and merchant accounts
- Prevention platforms (if you use Order Insight, Consumer Clarity, or prevention alerts)
- Any other platform that stores payment or customer information
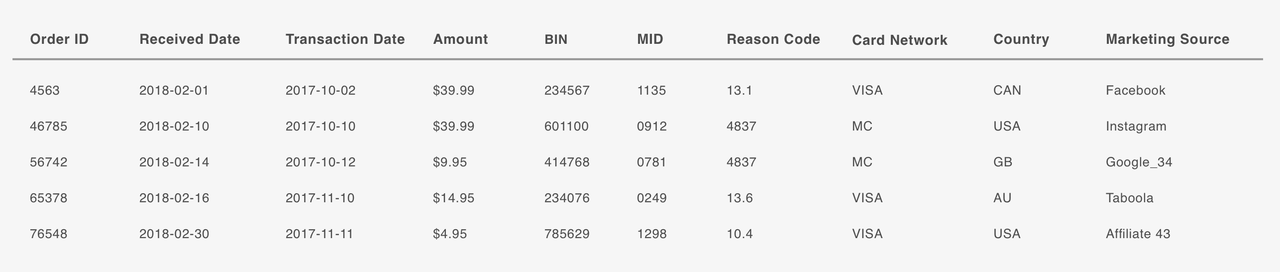
When a customer disputes a transaction, take the chargeback data provided by your payment processor and combine it with the original order information in your CRM. You’ll create a comprehensive report that contains the following data points for each chargeback you receive:
- Card brand (Visa®, Mastercard®, etc.) that processed the original transaction and resulting dispute
- Merchant account ID (MID) used to process the original transaction
- Chargeback amount (may differ from the original transaction amount)
- Chargeback reason code
- Marketing source that generated the original order
- Customer’s country
- The first six digits of the customer’s account number (known as an issuing bank identification number or BIN)
- Subscription cycle (if the transaction was part of a subscription billing model)
- Product name or SKU
- Date the transaction was processed
- Date the chargeback was received
Your reporting will look something like this:
If you also use tools to prevent chargebacks, you’ll want to repeat the process with your prevention data.
Sort and Chart Your Data
Once you’ve gathered all your data, you can sort it by individual variables for analysis. Then, apply calculations and chart your results.
Breakdown your chargeback data by some of the variables you collected in step #2: marketing source, product type, issuer BIN, customer’s country, reason code, price, billing cycle, and lag time (amount of time between the transaction and the dispute).
Create reports and charts that help you understand the data.
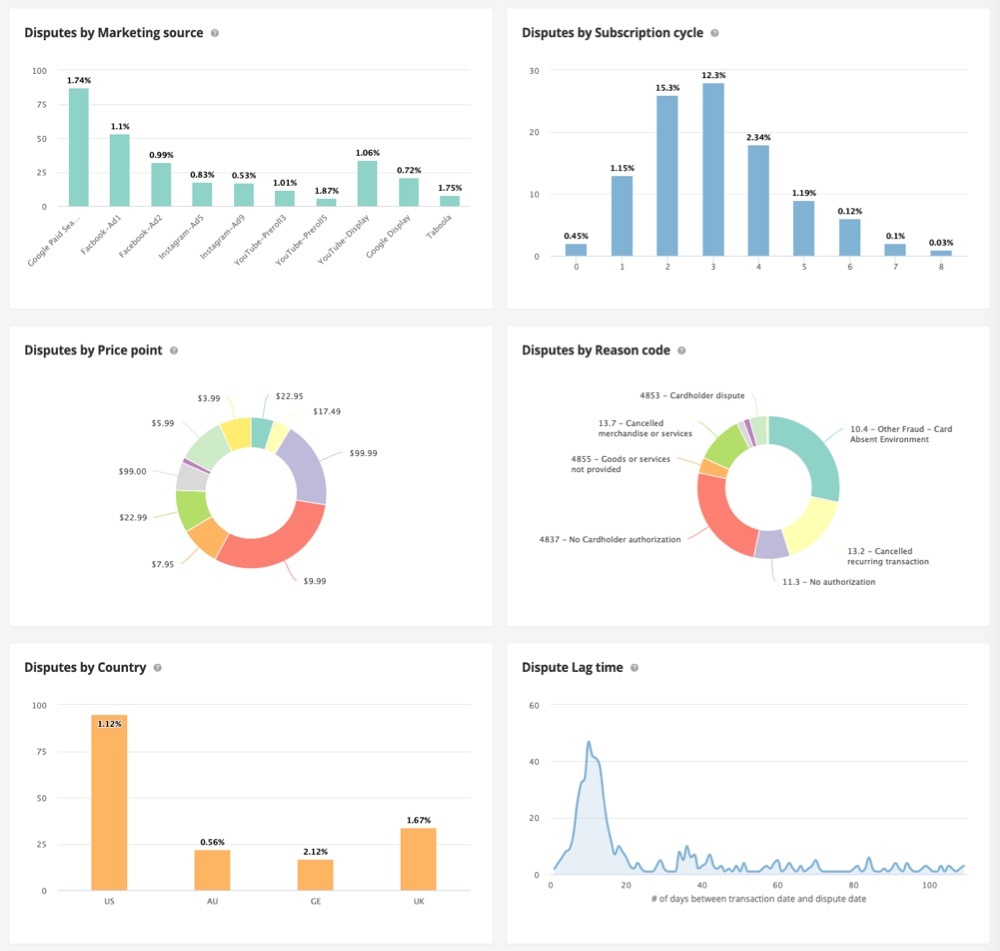
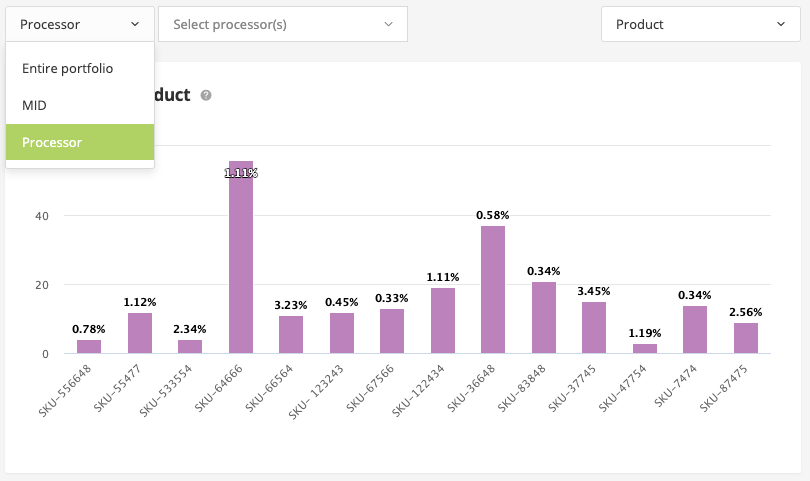
Ideally, you would have the ability to analyze data as granularly as possible, further segmenting the data by things like card brand, processor, or MID.
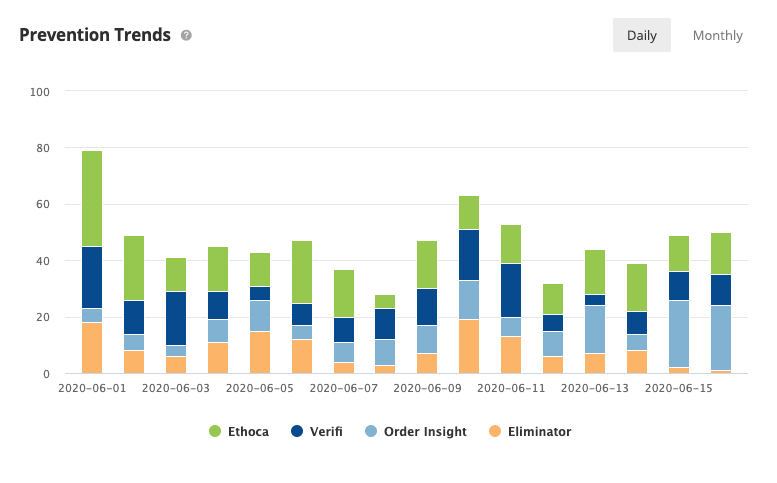
If you use tools to prevent chargebacks, you’ll want to create a second batch of charts for your prevention data.
Analyze Your Dispute Data and Gain Insights
Here’s where your hard work starts to pay off!
As you analyze your data over time, you’ll establish patterns and norms for your business. Then, anything that differs from the norm indicates a hidden issue that needs to be resolved.
For example, a merchant analyzed chargeback data by marketing source and discovered one social media platform in particular had a higher-than-normal chargeback ratio for a particular product.
Without chargeback data, the merchant likely would have put more marketing dollars into the campaign because it was converting so well. But the uncharacteristically high chargeback count proved something was wrong behind the scenes.
The merchant looked at the ad details and realized that, because the platform didn’t have an age targeting feature, they were marketing to a very young demographic which has a high propensity for friendly fraud (or illegitimate chargebacks). Switching to a different social media platform that did allow for age targeting of an older, more mature audience was all it took to reduce the risk of chargebacks.
You can replicate this discovery process in your own business. Here are some examples of what pattern anomalies could mean as you analyze data by different variables:

Analyze Chargeback Data by Product Type
- A high chargeback rate on low-dollar items could mean criminals are “running” cards (testing to see if the account is still open before making a large purchase).
- High-dollar items might be attracting criminals with stolen credit card information because of the resale value. High-dollar items could also be triggering buyer’s remorse.
- Customers might be using chargebacks as an alternate way to recover funds for merchandise with a no return policy.
- Goods might be lower quality than you suspected and damage easily.
Check a real-life example here:
How Midigator Analytics Help Stop Fraudsters

Analyze Chargeback Data by Issuer BIN
- An issuer might auto-chargeback transactions if your business practices are considered fraudulent or you are making repeated processing errors.
- You might receive a significant number of chargebacks from a particular BIN if a bank has suffered a data breach.
Check a real-life example here:
How Midigator Analytics Reveal Unexpected Reasons for Chargebacks

Analyze Chargeback Data by Customer’s Country
- If Dynamic Currency Conversion (DCC) is automatically applied to international orders instead of offered as an opt-in feature, chargeback rates could increase.
- Cultural differences might be making products or services seem inappropriate.
- Expectations for size, material, or other product characteristics could differ by region.
- Your sales method might not be well-received in certain countries, especially if you offer a free trial or introductory offer.
Check a real-life example here:
How Midigator Analytics Help Merchants Sell in More Countries

Analyze Chargeback Data by Subscription Billing Cycle
- Customers might forget about a subscription if a significant amount of time passes between each charge.
- A spike in chargebacks could indicate perceived value has decreased over time.
Check a real-life example here:
How Midigator Analytics Prevent Subscription Billing Chargebacks

Analyze Chargeback Data by Lag Time
- Chargebacks received earlier than normal could indicate immediately obvious issues like non-delivery or cyber shoplifting.
- Issues that arise later than normal could indicate hidden problems like faulty craftsmanship or counterfeit merchandise.

Analyze Chargeback Data by Reason Code
- More “cancelled recurring billing” and “credit not processed” reason codes could indicate that cancellations or refunds aren’t being handled in a timely fashion by your customer service team. Or policies aren’t clear or easily accessible.
- If you receive more “unauthorized transactions” reason codes than is normal, you might need to conduct manual reviews, adjust fraud detection rules, or add additional layers of fraud prevention.
- “Not as described” chargebacks could be caused by misleading, inaccurate, or incomplete product descriptions or ads.
- An influx in “merchandise not received” reason codes could indicate the fulfillment department isn’t able to keep up with demand, delivery methods are too slow, or inventory is running low.
Check a real-life example here:
How Midigator Analytics Help Uncover Merchant Errors
If you use prevention tools, you can conduct the same analysis. Prevention data is unique in that it is available about two to five weeks earlier than chargeback data. Therefore, if you analyze prevention data, you can resolve issues sooner, prevent more merchant chargebacks, and limit the amount of revenue loss.
Update Policies and Procedures
Once you’ve identified the cause of your chargebacks, make updates to your policies and procedures to resolve the newly-exposed issues.
Conduct follow up analysis to be sure you found the correct problem and there aren’t other lingering issues to be addressed.
Manual Processes vs. Automation
Data analysis is a very effective way to solve issues at their source and prevent chargebacks. However, it can be a time consuming task if you have to manually process the data.
Unless you have access to surplus development resources to create an accurate system for data reporting and analysis, you might find it is more efficient and cost effective to use a chargeback management technology platform like Midigator.
The benefits of using technology to create analytics include the following:
- Efficient technology is less expensive than manual labor.
- You’ll have access to real time data.
- There is less chance of error.
- Your in-house team can focus exclusively on analyzing the data.
- If your business scales, the technology can seamlessly keep pace.
- You can access all your chargeback management tools and data from a single platform, ensuring transparency from the beginning to the end of the chargeback process.
If you find manually-created reports are more effort than they’re worth, let Midigator help. Try using technology to handle steps one through three so you can focus exclusively on data analysis and optimizing the customer experience.
Sign up for a demo to learn more.