Chargeback Rate: 6 Things to Know About Your Chargeback-to-Transaction Ratio
-

- May 30, 2019
- 5 minutes
Your chargeback-to-transaction ratio says a lot about your business. In fact, it probably reveals things you weren’t even aware of!
Here’s how to unearth the valuable insight and make the most out of your discoveries.
1. The chargeback-to-transaction ratio is a simple math equation.
The chargeback-to-transaction ratio (sometimes shortened to CTR) calculates the percent of transactions that result in chargebacks. The ratio takes the number of chargebacks and divides by the total number of transactions. Multiplying this by 100 provides the average chargeback rates.

NOTE: Card brands often use different terms to express the same concept. Instead of chargeback-to-transaction ratio, you might hear the phrase dispute-to-sales ratio.
2. If you break down your chargeback ratio by different variables, you’ll learn a lot about your business and prevent a lot of disputes from happening.
At Midigator®, we believe data analysis is one of the most powerful chargeback prevention tools available.
When you take a deep dive into your data, you learn things you wouldn’t otherwise know. This unique insight helps you discover why customers are charging back so you can solve issues at their source.
Here’s how we suggest you analyze your data:
- Break down your chargeback data into different categories based on transaction characteristics (for example the marketing source that generated the sale, the cardholder’s country, the type of product that was disputed, the card issuer, etc.).
- Calculate the chargeback-to-transaction ratio for each variable within those categories (for example, the chargeback-to-transaction ratio for purchases in Canada, Australia, the UK, etc.)
- Isolate the 10 variables with the highest chargeback-to-transaction ratios in each category.
- Work to reduce the risk associated with each variable in each category (for example, remove high-risk merchandise from your inventory, change prices to increase perceived value, retarget your marketing campaigns to reach a lower-risk audience, etc.)
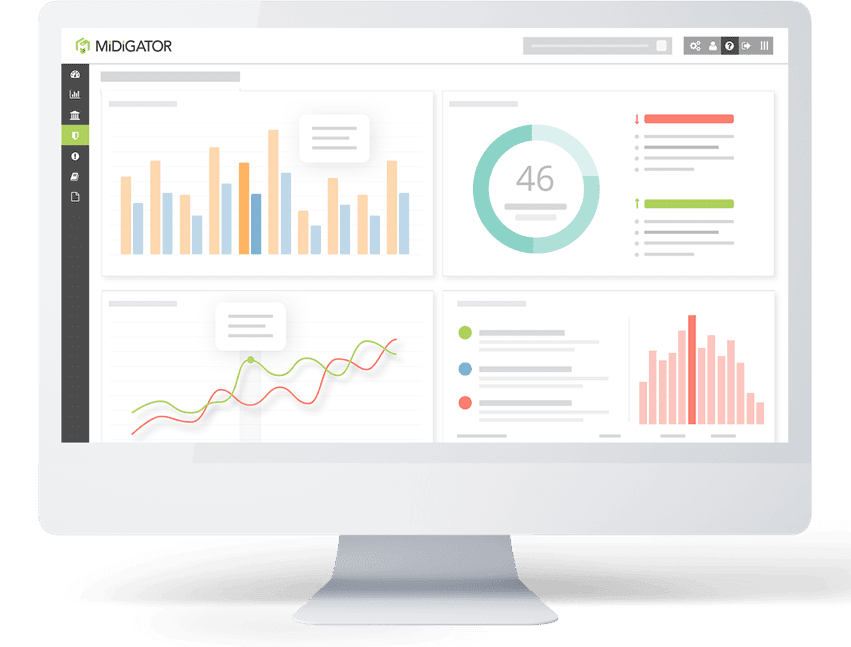
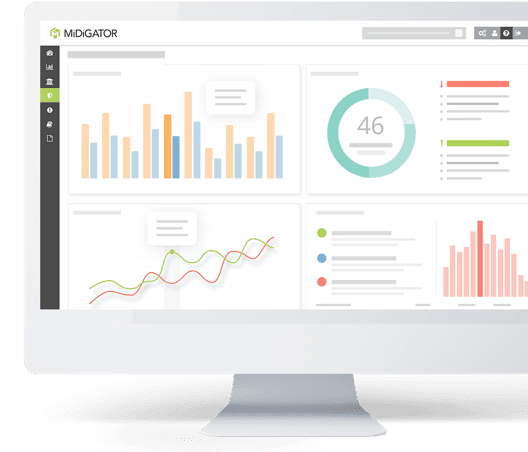
If data analysis sounds like a viable strategy but collecting all that information seems intimidating, Midigator can help. Sign up for a demo, and we’ll show you how the technology can collect your data in real time and display it in easy-to-analyze charts.
3. The chargeback-to-transaction ratio can help you maintain perspective.
Data analysis is powerful, but it can be dangerous if done incorrectly. Without context, data analysis can lead to incorrect conclusions. That’s why your two-factor chargeback-to-transaction ratio often provides a more accurate analysis than a one-factor key performance indicator (KPI) like chargeback count or sales volume.
Consider this hypothetical situation as an example: a merchant launched two new marketing campaigns at the same time. Within a few months, the merchant’s chargeback count spiked. The merchant traced 65% of the chargebacks to Campaign A. Because it seemed like that campaign was riskier than the other, the merchant planned to turn it off.
But analyzing the chargeback-to-transaction ratio revealed something completely different. Campaign A had a high chargeback count, but it was also responsible for bringing in 80% of the new sales.
Campaign B had a lower chargeback count but also a lower number of sales. Therefore, Campaign B had a higher chargeback-to-transaction ratio and could be a greater risk than Campaign A — despite what the initial chargeback count indicated.
65 chargebacks
8,000 sales
0.81% CTR
35 chargebacks
2,000 sales
1.75% CTR
The opposite scenario could happen too. If a marketing campaign has a high conversion rate, it is usually considered a success. However, a high conversion rate coupled with high chargeback rates usually has more risk than reward. This could indicate anything from problems with product descriptions to mounting friendly fraud.
For accurate data analysis, remember to maintain perspective and context.
4. A lot of people are really interested in your monthly chargeback-to-transaction ratio.
The card networks (Visa, Mastercard, etc.) require that each acquirer (bank) calculates your chargeback ratio and monitors it on a monthly basis.
The formula is the same for all networks, but the data source used in the formula varies slightly.
Visa, American Express, and Discover

Mastercard

For network monitoring, each merchant account has its own chargeback-to-transaction ratio. Also, only the relevant card network’s transactions and chargebacks are counted. For example, transactions processed with Visa cards aren’t included in the Mastercard chargeback-to-transaction ratio for merchant accounts.
5. If your chargeback-to-transaction ratio gets too high, you could have problems.
The card networks carefully monitor the risks associated with each business that processes payment card transactions. There are several different risk metrics that the card networks keep an eye on, and the monthly chargeback-to-transaction ratio is one of them.
The networks have set thresholds, or limits, that merchants need to abide by. If your chargeback-to-transaction ratio is above the acceptable limit, especially in high risk industries, you’ll be placed in a monitoring program as a high risk merchant with even greater scrutiny (learn more about the Mastercard programs here and the Visa programs here).
Chargeback Monitored Merchant
1% or higher chargeback-to-transaction ratio
and 100 or more chargebacks a month
Excessive Chargeback Merchant
1.5% or higher chargeback-to-transaction ratio
and 100 or more chargebacks a month

Standard Program
0.9% or higher chargeback-to-transaction ratio
and 100 or more chargebacks a month
Excessive Program
1.8% or higher chargeback-to-transaction ratio
and 1,000 or more chargebacks a month
If you are enrolled in a chargeback monitoring program, you’ll pay additional fees and penalties. You could also lose payment processing privileges.
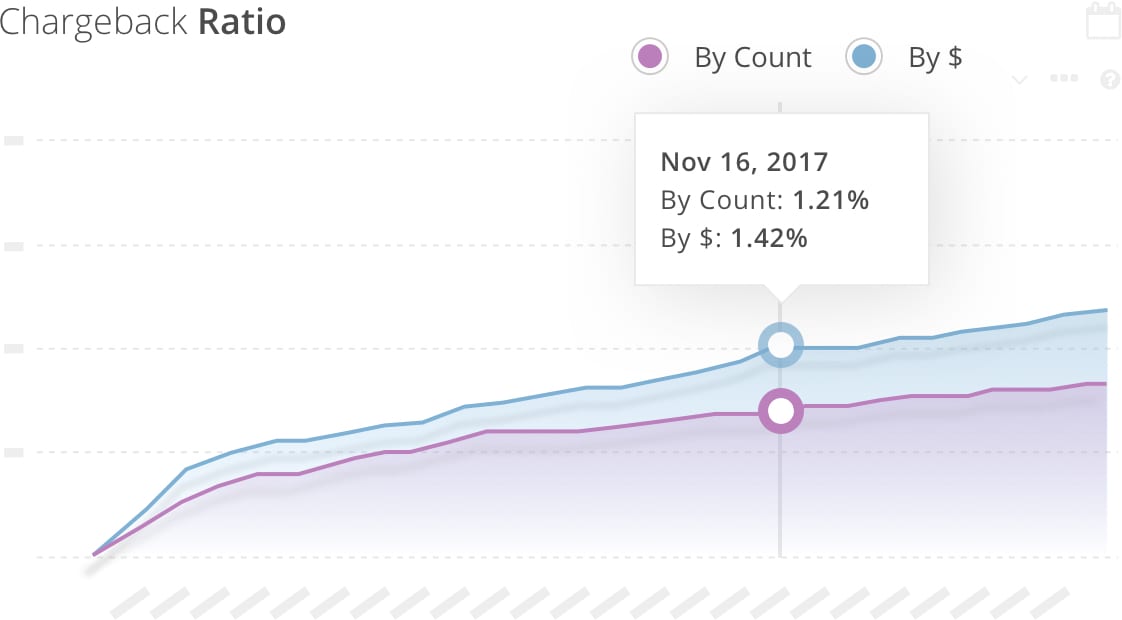
6. You should also monitor your chargeback-to-transaction ratio by dollar amount.
Another valuable tip is to monitor the ratio of chargeback value to transaction value. Divide the dollar amount of your transactions that result in chargebacks by the dollar amount of all transactions.
This data can help you evaluate net revenue instead of just gross revenue as you work to manage chargebacks. Watch for unexpected spikes in activities and work to reduce risk to increase profitability.
Want Help Managing Your Chargeback-to-Transaction Ratio?
Your monthly chargeback-to-transaction ratio is a valuable business asset, and data-driven insight can help you protect it.
If you’d like help managing your ratio and preventing breaches, or simply want to learn more about the concept of risk management through data analysis, contact Midigator today. Our team of experts can offer additional suggestions and insider tips.